Tools & Utilities

15 Interesting VS Code Settings

I’ve been using VS Code for quite some time now. In fact, given the nature of my work recently I’ve found myself spending more time in VS Code than in VS 2017 over the past several months. The “out-of-the-box”, “stock” experience with VS Code is truly fantastic and has provided me with just about all the functionality I’ve needed.

Sure, I’ve added some extensions such as C#, mssql, Babel JavaScript, and transformer to address some gaps but by and large, I’ve found the experience to be more than sufficient for my needs. That said, I recently attended a talk that began by highlighting a dozen or so of the interesting configuration options that can be set to tweak the experience.

Given that I’ve never really paid much attention to the settings I thought I should dive in, look over the nearly 500 settings, and highlight a few which I found most interesting. Although the vast majority are pretty typical for an editor there are plenty that can have a significant impact on the way we work so without further ado, here are my picks for the top 15 most interesting VS Code settings! (more…)

Advertisement

C# 6 Verbatim Interpolated String Literals

It’s no secret that string interpolation is one of my favorite C# 6 language features because of how well it cleans up that messy composite formatting syntax. A few days ago I was working on some code that contained a verbatim string that included a few of the classic tokens and I wondered if string interpolation would work with verbatim strings as well.

After a quick glance over the MSDN documentation for string interpolation revealed nothing I just decided to give it a shot by adding a dollar sign ($) ahead of the existing at (@) sign and filled the holes with the appropriate expressions. Much to my delight this worked beautifully as shown in the snippet below!

var name = "Dave";
var age = 36;

var sentence = $@"Hello!
My name is {name}.
I'm {age} years old.";

Console.WriteLine(sentence);

I later discovered that even though this feature doesn’t seem to be listed in the MSDN documentation (at least anywhere I could find it) that it is explicitly called out in the C# 6 draft specification so hopefully it’ll find its way to the rest of the documentation at some point.

Crashing Visual Studio 2015 with Explicit Interface Implementations

In F#, all interface implementations are always explicit meaning that the interface methods will only be accessible when treating the implementing type as that interface. This makes sense in F# because it removes all ambiguity around what the method applies to. Explicit implementations also force us into coding to the interface because other miscellaneous members of the implementing type aren’t exposed through the interface definition. For these reasons I’ve been hooked on explicit interface implementation and even use it almost exclusively with great success in my C# applications.

Imagine my surprise then when Visual Studio 2015 crashed when I tried to rename an explicitly implemented interface method! The first time it happened I figured it was probably just Visual Studio misbehaving but when I reopened the solution and tried again the same thing happened! Clearly there was something more to this.

RefactorCrash

Renaming an explicitly implemented interface method causes Visual Studio 2015 to crash.

Hoping that I’d perhaps stumbled upon something that was fixed and included in Update 1, I upgraded Visual Studio and tried again. The crash still occurred.

To narrow down the issue I created a brand new solution with a console application. Within the new project I defined a simple interface with a single method and explicitly implemented it in a class. At this point I attempted to rename the method and it worked as expected. I then tried renaming the interface method directly on the interface and that also worked as expected. Then I figured that it must have something to do with how the interface was being used so I created an instance of the class, converted it to the interface, and tried the rename again and it was successful. Finally, I added a line to invoke the interface method and tried the rename one more time. Oddly, it again worked as expected.

On a whim I decided to move the interface and implementation into a separate project. After adding the project reference and doing a test build I again tried to rename the method and sure enough, Visual Studio crashed. I’ve since played with a few different combinations and have been able to successfully recreate the crash as long as the interface is defined in a separate assembly and I tried renaming the method via the explicit implementation.

In summary, it appears that in order to recreate this crash the following conditions must be met:

  • Interface must be explicitly implemented
  • Interface must be defined in a separate assembly than where it’s used
  • Rename must be attempted against the explicit implementation
  • Interface method must be invoked – simply creating an instance won’t cause the crash.

I’ve submitted the issue to Microsoft on Connect but this seems like such an edge case I’d be surprised to see a fix anytime soon. In the mean time, if this is something you encounter you can safely rename the method on the interface itself or at the call site; neither of those seemed to be an issue.

If you’d like to mess around with this issue on your own, I’ve shared my sample project on GitHub.

CTRL + BACKSPACE

I’ve been working in Visual Studio for years – long enough that many of the most useful keyboard shortcuts are now permanently embedded in my finger muscle memory. Sure, there are plenty of shortcuts I need to look up from time to time but I usually think I have a pretty good handle on them. Every once in a while though, I do something silly and Visual Studio either rewards or punishes me in an unexpected way. Today was one of those days.

For whatever reason, I was holding the ctrl key when I hit backspace in VS2013 and suddenly the entire property name just disappeared! I tried it again and the preceding dot disappeared. One more time and the object name disappeared.

I have no idea how it’s taken me this long to stumble upon this shortcut but I’m glad I did! You can see the behavior in the animation below.

VisualStudioQuickBackspace

Receiving Webhooks With IIS Express

One of the projects I’m currently working on is using a service that reports various events back to our system via webhooks. Since the features I’m working on aren’t ready for deployment yet I was looking for a decent way to test the integration in my development environment to ensure that I’m not only receiving the correct data but also that I’m handling it properly.

The service’s documentation recommended pointing the webhooks to another service such as RequestBin to inspect the contents. I did mess around with that approach for a bit and although I was certainly able to see the requests in the RequestBin log and push them on to the application with fiddler, it really didn’t seem like an adequate solution and I was tired so I went to bed.

It turns out that sleeping on it was exactly what I needed. Sometime overnight I subconsciously worked out a better solution; I could open up IIS Express to handle remote connections and configure NAT on my router to forward requests for that port directly to the IIS Express instance. It turns out that getting all this working was actually quite simple.

Allowing Remote Connections

Allowing remote connections to IIS Express requires a little work but it’s pretty straight-forward and is outlined in this stackoverflow post. In short we need to:

  1. Create an additional IP binding for the IIS Express site to allow traffic from all hosts.
  2. Allow connections to the port from anyone
  3. Create a firewall rule to allow traffic to the port on the development machine

Creating an IIS Express Binding

IIS Express sites are managed per-user. To create the IIS Express binding we simply need to create a new entry for the site in the configuration file located at %userprofile%\documents\iisexpress\config\applicationhost.config. In the file locate the site then duplicate the binding, changing the allowed host to *. For example, if the current binding is:

I’ve used port 99999 in these examples for demonstration purposes only. You’ll want to use the port listed in your configuration file.

<binding protocol="http" bindingInformation="*:99999:localhost" />

You’d create a copy and change localhost to * such that it reads like this:

<binding protocol="http" bindingInformation="*:99999:*" />

It’s very important that you leave the original binding in place. Yes, it is redundant to have a binding for all hosts and another for only localhost but Visual Studio uses the localhost binding to initialize IIS Express. If that binding isn’t present Visual Studio will create a duplicate site entry and you’ll likely start seeing errors such as the one pictured below.

URL Binding Failure

URL Binding Failure

Setting Security on the Port

Once you’ve created the IIS Express binding you need to allow connections to the port. This is done by executing target=”_blank”>netsh to add a URL reservation for the new binding. In this case we’ll be using netsh http add urlacl to register the address we bound to the IIS Express site and granting permission to everyone.

netsh http add urlacl url=http://*:99999/ user=everyone

Note that “everyone” refers to the Everyone group in Windows. If you’re using a non-English version you’ll need to change that to the localized name for your language.

Creating a Firewall Rule

The final step is allowing traffic to that port through the local firewall. Accomplishing this varies according to which firewall solution you’re using. For Windows firewall you can control this through the control panel or by executing the following netsh command which changes some advanced firewall configuration settings.

netsh advfirewall firewall add rule name=”IISExpressWeb” dir=in protocol=tcp localport=99999 profile=private remoteip=any action=allow

Configuring NAT

Configuring NAT is not something I can really help with in this article because each environment will have its own instructions and restrictions. For me and my home office network it was easy because I simply had to add a custom application that referenced the configured port and host machine in my router’s firewall configuration.

Alternatively, I could have configured the IP Passthrough to route traffic to the development machine but I deemed this to be too much exposure to the outside world and left it with NAT.

Accepting Webhooks

Once I’d configured everything on my network to accept the webhook traffic I went to the external application’s dashboard and registered my computer as a webhook recipient using the WLAN IP address I obtained from my router’s status page and the port I bound to IIS Express for the application. I then set a breakpoint in the webhook processing logic, ran the application, made a change in the remote system to initiate sending an event, then watched in amazement as my breakpoint was hit and the watch window showed data received from the remote service.

Mission accomplished.

Changing the Default TFS Check-in Action

It’s been a number of years since I worked with TFS. Now that I’m back in that world one of the things that has bitten me is that by default any tasks tied to a check-in are resolved by default. Automatically marking tasks as complete has left me scratching my head in bewilderment as I wondered why a task I’m actively working on was no longer listed under my tasks. I can see the utility of this behavior in some circumstances but I often make incremental check-ins as I work through more complex tasks so clearly I don’t want checking in my changes to automatically close the task.

Since relying on my memory to change the check-in action from Resolve to Associate clearly isn’t adequate here I looked for some way to change the default behavior. I found that there are two ways to achieve this, neither of which are obvious.

The first method is to remove the Microsoft.VSTS.Actions.Checkin action from the work item template. The other method applies only to the client machine but requires a registry edit. Neither option is particularly great but given that the first option requires you to have authorization to modify the template and applies to each user of the template, I opted for the second approach.

To disable the default resolution option you need to locate HKEY_CURRENT_USER\Software\Microsoft\VisualStudio\12.0\TeamFoundation\SourceControl\Behavior\ResolveAsDefaultCheckinAction and change the ResolveAsDefaultCheckinAction value from True to False. After making the change, restart Visual Studio and the Associate should now be selected the next time you try adding a work item to the check-in.

ResolveAsDefaultCheckinAction option

Fun with Code Diagnostic Analyzers

A few days ago I posted an article detailing how to construct a code diagnostic analyzer and code fix provider to detect if..else statements that simply assign a variable or return a value and replace the statements with a conditional operator. You know, the kind of things that code diagnostic analyzers and code fix providers are intended for. As I was developing those components I got to thinking about what kind of fun I could have while abusing the feature. More specifically, I wondered whether could I construct a code diagnostic analyzer such that it would highlight every line of C# code as a warning and recommend using F# instead.

It turns out, it’s actually really easy. The trick is to register a syntax tree action rather than a syntax node action and always report the diagnostic rule at the tree’s root location. For an extra bit of fun, I also set the diagnostic rule’s help link to fsharp.org so that clicking the link in the error list directs the user to that site.

Here’s the analyzer’s code listing in its entirety:

using Microsoft.CodeAnalysis;
using Microsoft.CodeAnalysis.Diagnostics;
using System.Collections.Immutable;

namespace UseFSharpAnalyzer
{
    [DiagnosticAnalyzer(LanguageNames.CSharp)]
    public class UseFSharpAnalyzerAnalyzer : DiagnosticAnalyzer
    {
        internal static DiagnosticDescriptor Rule =
            new DiagnosticDescriptor(
                "UseFSharpAnalyzer",
                "Use F#",
                "You're using C#; Try F# instead!",
                "Language Choice",
                DiagnosticSeverity.Warning,
                isEnabledByDefault: true,
                helpLink: "http://fsharp.org");

        public override ImmutableArray<DiagnosticDescriptor> SupportedDiagnostics { get { return ImmutableArray.Create(Rule); } }

        public override void Initialize(AnalysisContext context)
        {
            context.RegisterSyntaxTreeAction(AnalyzeTree);
        }

        private static void AnalyzeTree(SyntaxTreeAnalysisContext context)
        {
            var rootLocation = context.Tree.GetRoot().GetLocation();
            var diag = Diagnostic.Create(Rule, rootLocation);

            context.ReportDiagnostic(diag);
        }
    }
}

When applied to a C# file, the result is as follows:

Use F# Analyzer

This is clearly an example of what not to do with code analyzers but it was fun to put together and see the result nonetheless. If you’ve thought of any other entertaining uses for code analyzers, I’d love to hear about them!

I Can Analyze Code, And So Can You

[12 December 2014 – Update 1] Upon setting up a new VM I realized that I missed a prerequisite when writing this post. The Visual Studio 2015 Preview SDK is also required. This extension includes the VSIX project subtype required by the Diagnostic and Code Fix template used for the example. I’ve included a note about installing the SDK in the prerequisites section below.

[12 December 2014 – Update 2] The github project has moved under the .NET Analyzers organization. This organization is collecting diagnostics, code fixes, and refactorings like to showcase the capabilities of this technology. The project link has been updated accordingly.

Over the past several years, Microsoft has been hard at work on the .NET Compiler Platform (formerly Roslyn). Shipping with Visual Studio 2015 the .NET Compiler Platform includes a complete rewrite of the C# and Visual Basic compilers intended to bring features that developers have come to expect from modern compilers. In addition to the shiny new compilers the .NET Compiler Platform introduces a rich set of APIs that we can harness to build custom code diagnostic analyzers and code fix providers thus allowing us to detect and correct issues in our code.

When trying to decide on a useful demonstration for these features I thought of one of my coding pet peeves: using an if..else statement to conditionally set a variable or return a value. I prefer treating these scenarios as an expression via the conditional (ternary) operator and I often find myself refactoring these patterns in legacy code. It certainly would be nice to automate that process. It turns out that this is exactly the type of task at which diagnostic analyzers and code fix providers excel and we’ll walk through the process of creating such components in this post. (more…)

More VS2013 Scroll Bar Magic

Yesterday I wrote about map mode, an exciting enhancement to Visual Studio 2013’s vertical scroll bar. If you haven’t enabled the feature yet, go do it, I’ll wait.

If you had the Productivity Power Tools extension installed prior to enabling the feature, you may have noticed that there are some extra annotations in the scroll bar. These annotations, shown in the form of vertical lines and “bubbles” illustrate scope and nesting level.

You can control whether these annotations are displayed by changing the “Show code structure in the margin” setting under Productivity Power Tools/Other extensions in the options dialog. So far, I think they’re pretty helpful so I plan on leaving them enabled; at least for a while.

EnableCodeStructure

VS2013 Scroll Bar Map Mode

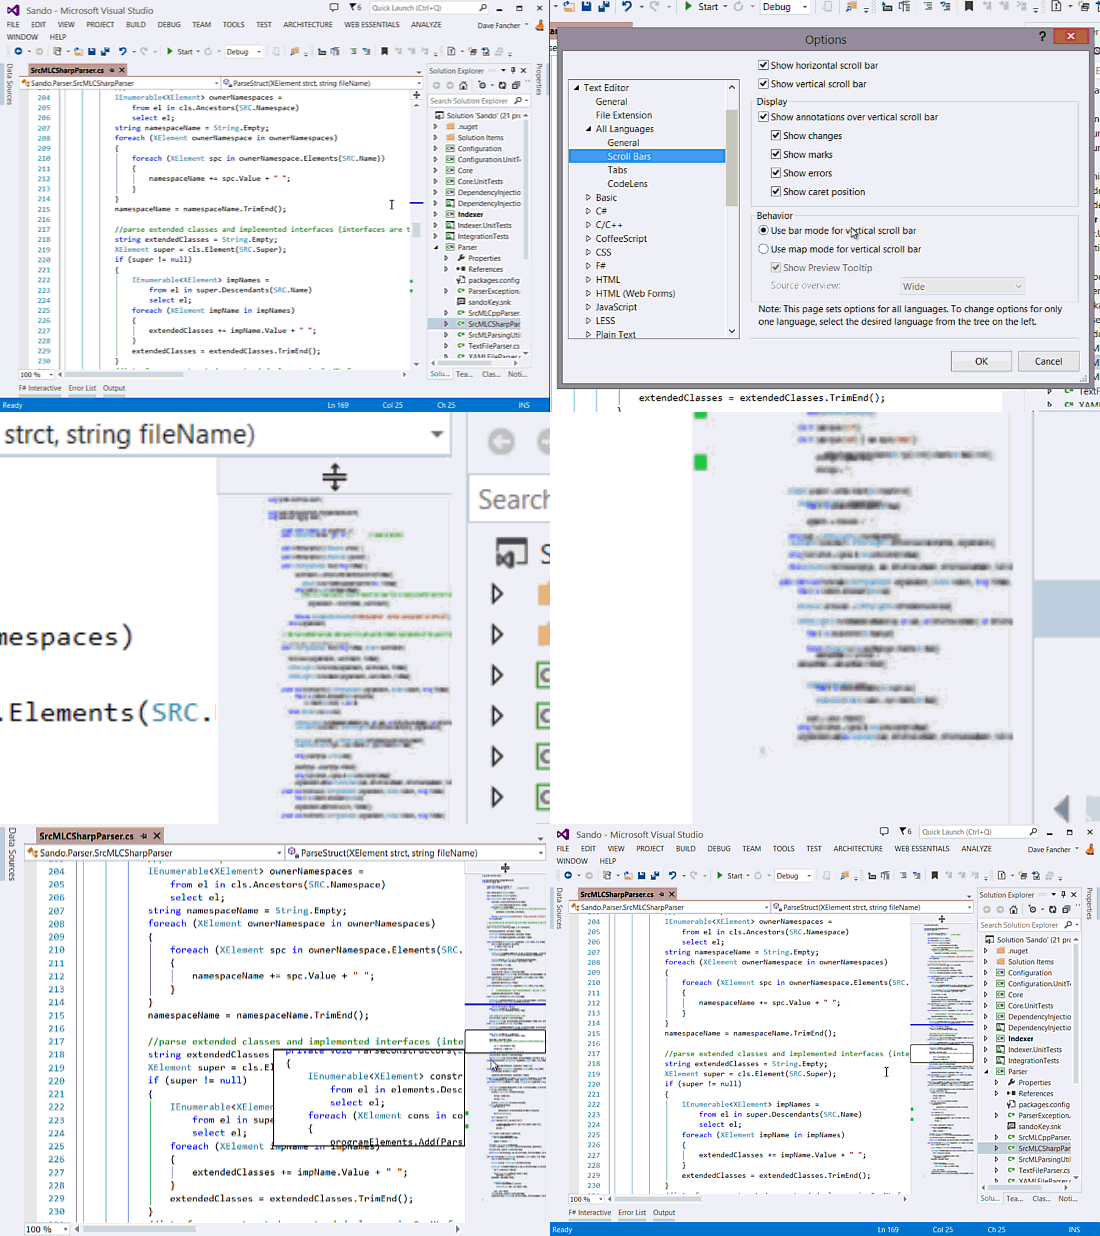
At Nebraska Code Camp this past weekend, Mike Douglas talked a bit about the developer productivity enhancements included in VS2013. One of the features that I’d missed until his talk was the vertical scroll bar’s map mode.

Beyond the now familiar annotations for changes, errors, and cursor position, the scroll bar’s map mode shows a low-resolution depiction of the structure of the code in the current file. This can be helpful for ascertaining the context of a particular piece of code or identifying duplicated code by observing patterns in the structure, among other things.

Perhaps just as useful is that when map mode is enabled, the scroll bar can also show a tooltip containing a preview of the code at any point on the map. To see the tooltip, simply hover over a point of interest.

I’ve only just started to use this feature but I think it’ll aid immensely in code discovery.

EnableScrollbarMap